Started our DATA UNIT today!!
Vocabulary:
Data- Information
Categories- Ways to separate things (blue is a category of color)
Categorical Data- Data that is not numbers (example, favorite color, sport you play, etc)
Bar Graph- Graph that uses bars to compare data
Dot Plot- Graph that shows dots above a label to show data
Frequency Table- table that shows how often something happens
Pictograph- Graph that uses pictures to show data
Titles- Next to graphs that explain what the graph is able
Labels- Y and X axis should be labeled to explain the data
Scaled Intervals- Explain how close the numbers are

The data this graph shows is about chocolate ice cream.
The categories are: rocky road, dark chocolate, Reeses Pieces, chocolate, mouse tracks.
The least amount was rocky road.
The most amount was chocolate and Reeses Pieces.
Reeses Pieces had 2 more votes than dark chocolate.
Chocolate had 2 more votes than mouse tracks.
Rocky road has the fewest votes.
This graph was a bar graph.

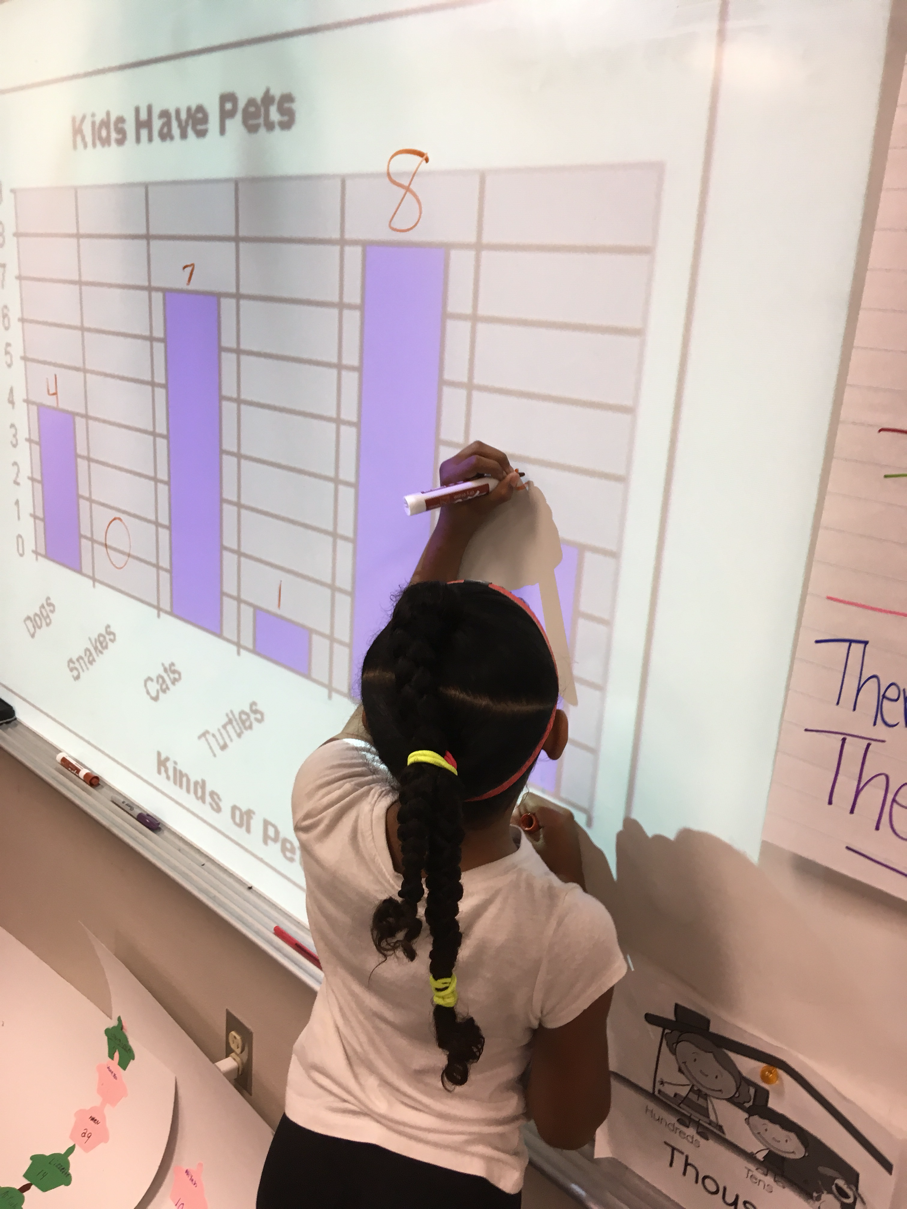
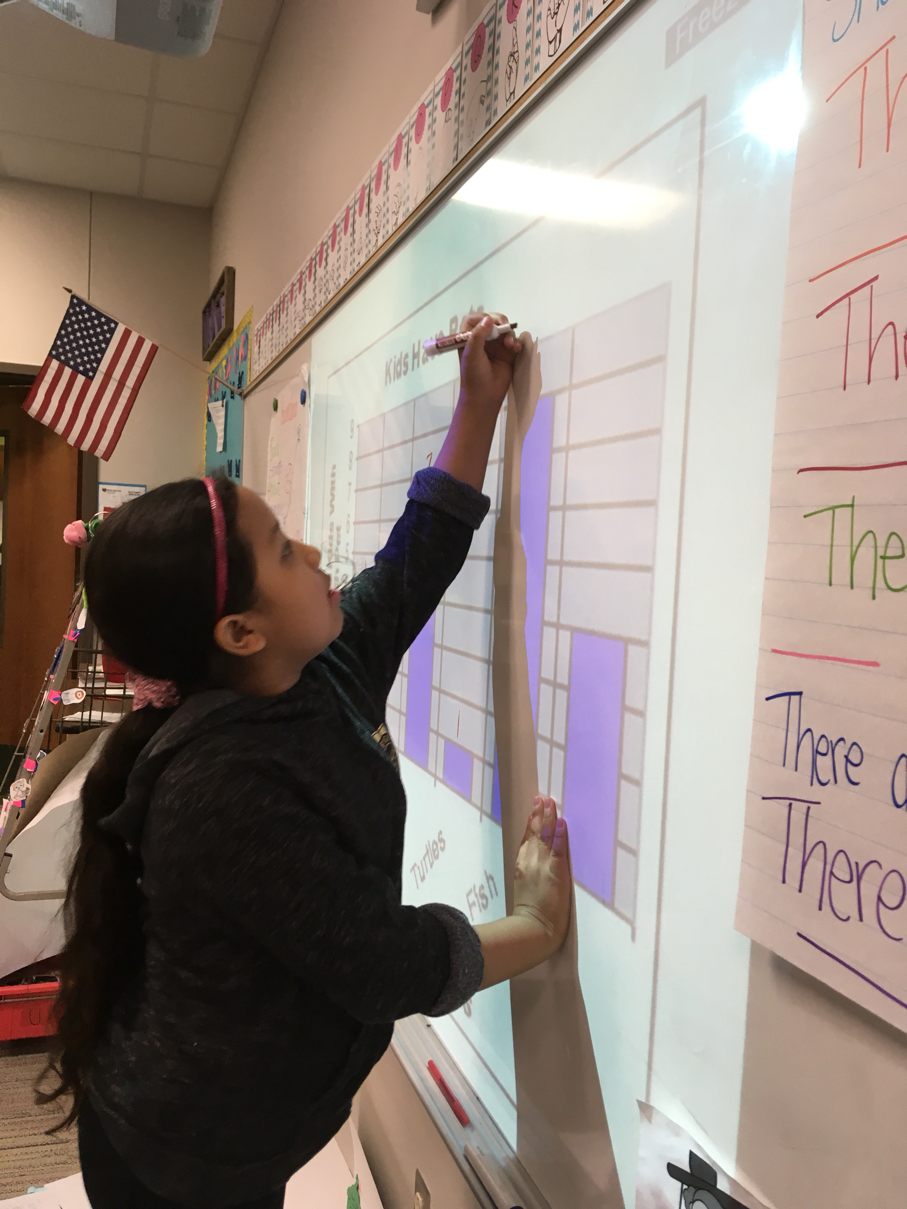
The data shows about kids having different pets.
The categories in this graph were: dogs, snakes, cats, turtles, fish, birds.
The least amount was snakes.
The most amount was fish.
Dogs and birds had the same number.
There are 4 more people have dogs than snakes.
There are 3 fewer turtles than birds.


No comments:
Post a Comment